[1] "/Users/josh/Dropbox/Research-Data-Services-Workshops/research-data-services-r-workshops/slides"Getting Started in R
Josh Allen
Department of Political Science at Georgia State University
1/20/23
Research Data Services
Our Team
Get Ready Badges

How To Get the Badges
The Workshop
Why Use R?

Why R and RStudio?(cont)
Alongside Python, R has become the de facto language for data science.
Open-source (free!) with a global user-base spanning academia and industry.
The community is insanely nice
- Especially compared to Python and Stata
A great “first” language to learn
Supports all types of statistical methods and data collection
R? Rstudio? Whats the Difference?
- R is a statistical programming language
- RStudio is a convenient interface for R (an Integrated Developer Environment, IDE)
- At its simplest:
- R is like a car’s engine
- RStudio is like a car’s dashboard

Navigating RStudio
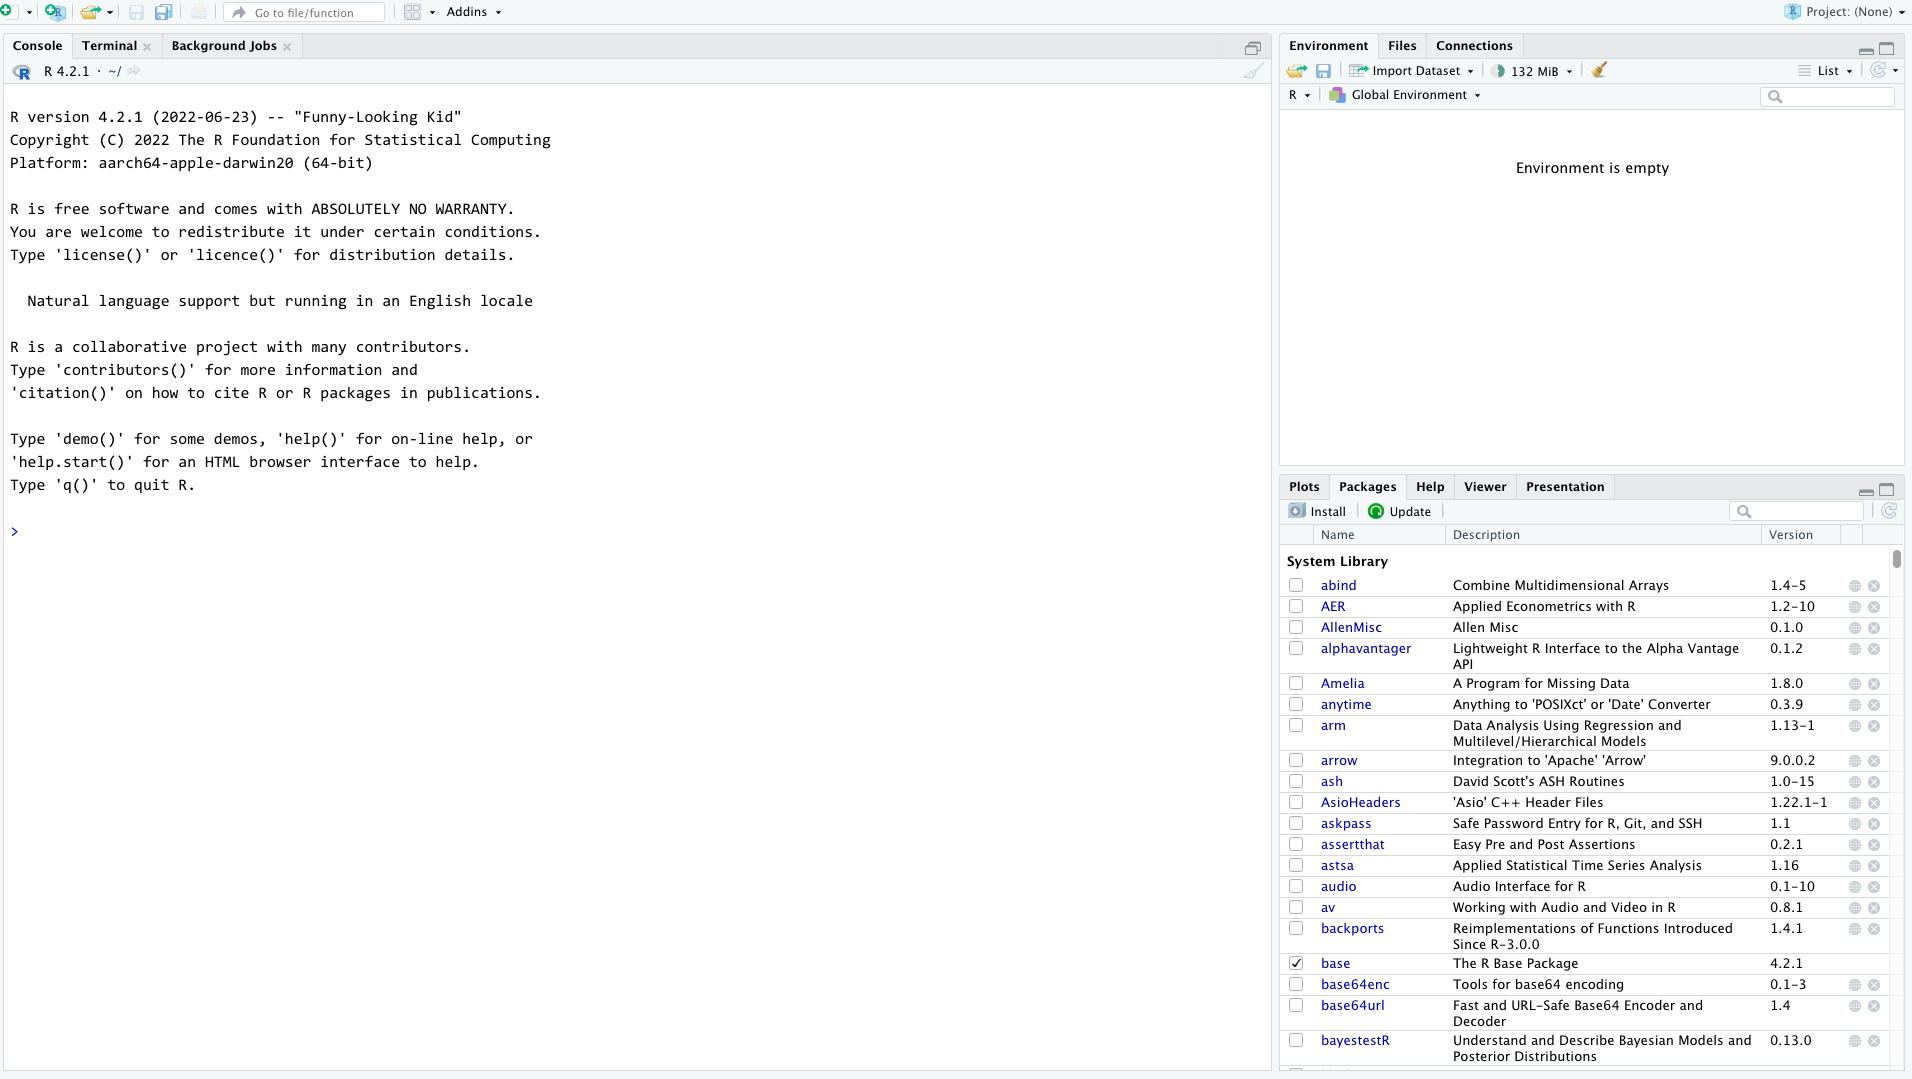
project files are here
imported data
shows up here
code can go here
Navigating RStudio
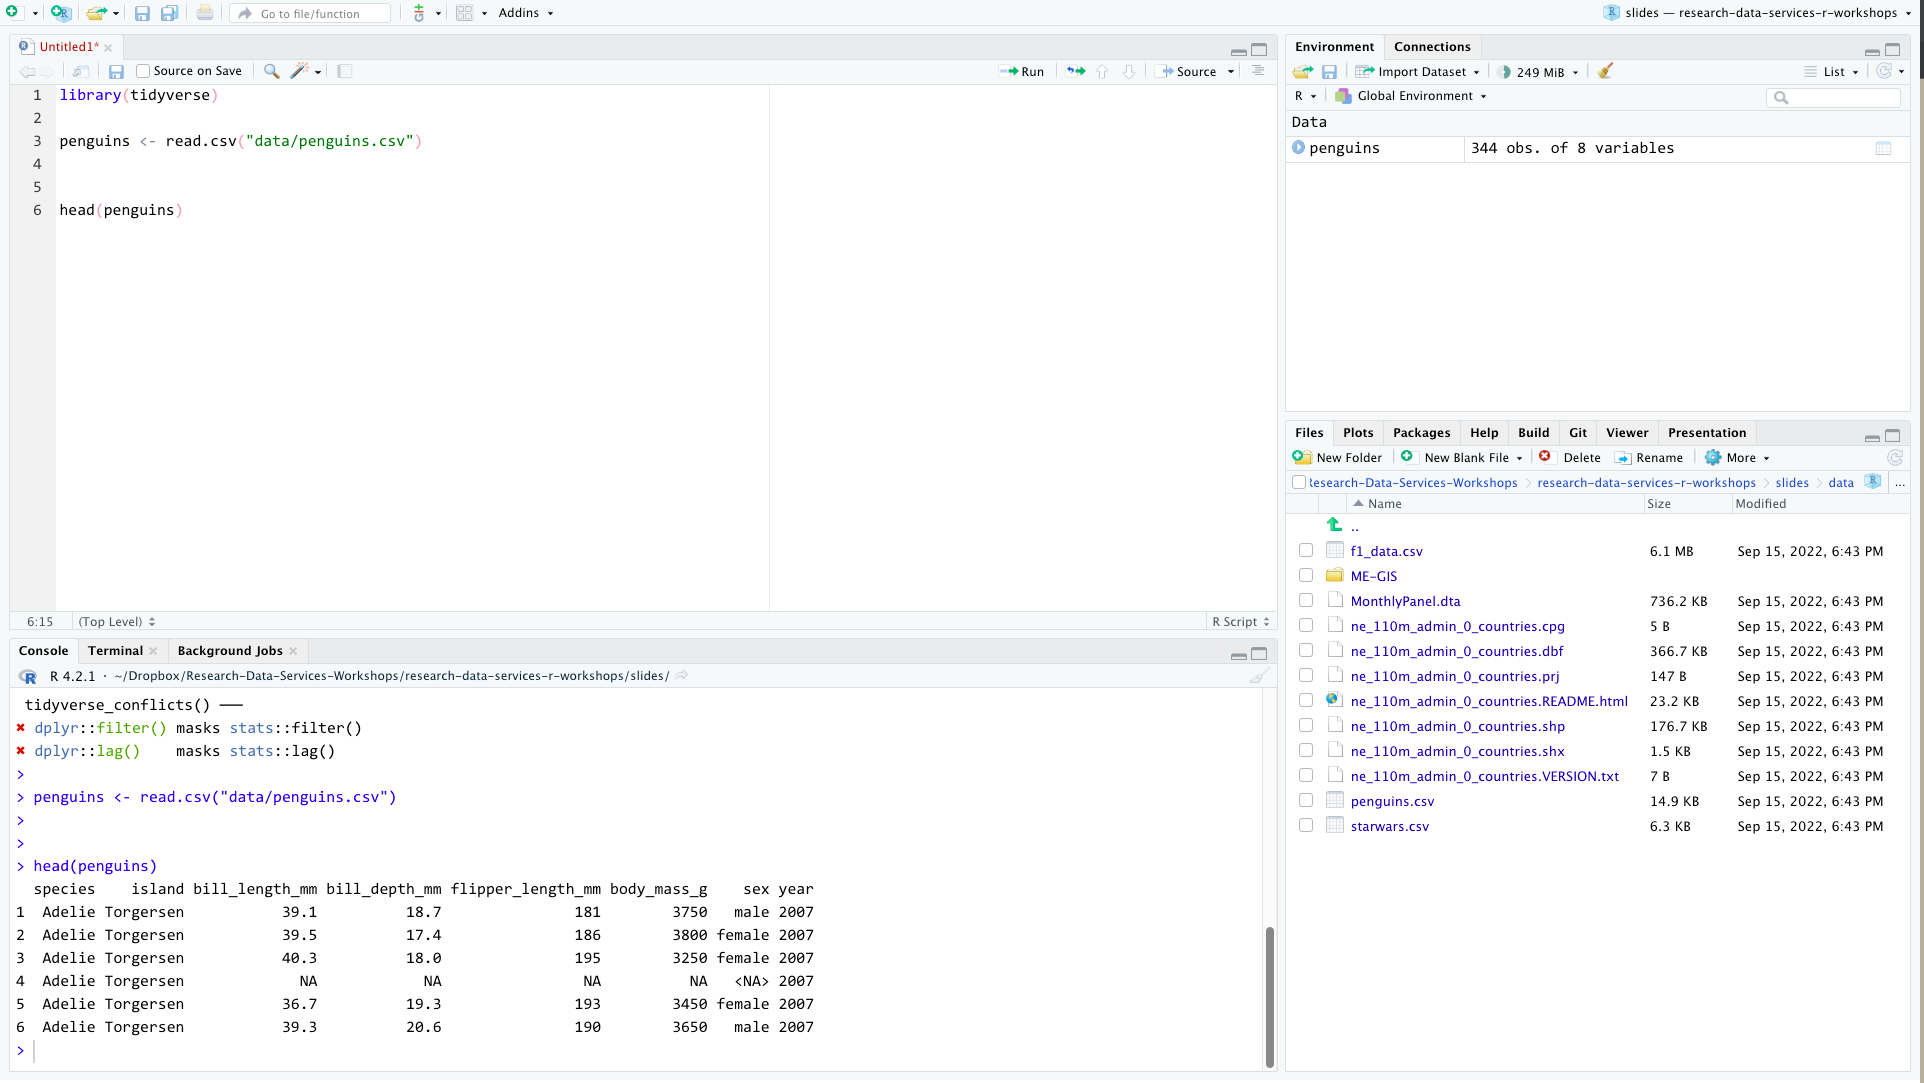
project files are here
imported data
shows up here
code can go here
Setting Your Working Directory
Your working directory is where all your files live
You may know where your files are…
But R does not
If you want to use any data that does not come with a package you are going to need to tell R where it lives
Cats and Boxes

You can put a box inside a box.
You can put a cat inside a box
You can put a cat inside a box inside of a box
You cannot put a box inside a cat
You cannot put cat in a cat
Setting Your Working Directory(cont)
How To Make Your Life Easier
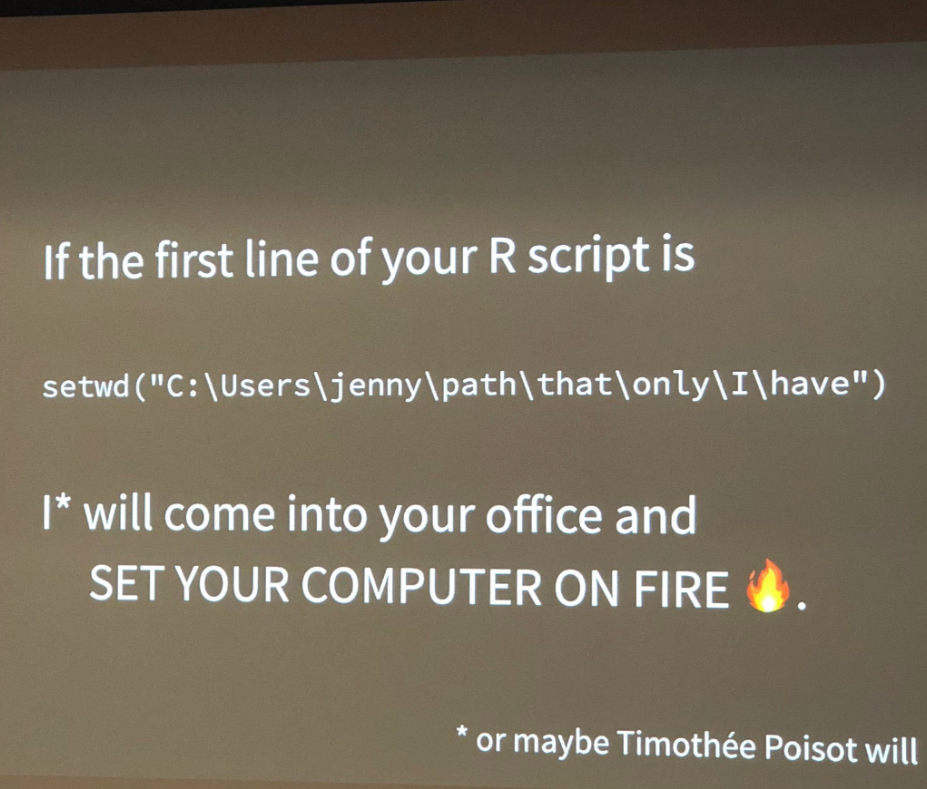
source: Jenny Bryan
How To Make Your Life Easier
Working Directory for My Laptop
"/Users/josh/Dropbox/Research-Data-Services-Workshops/research-data-services-r-workshops/slides"
Working Directory of My Office Computer
"/Volumes/6TB Raid 10/Dropbox/Research-Data-Services-Workshops/research-data-services-r-workshops/slides"
R Projects
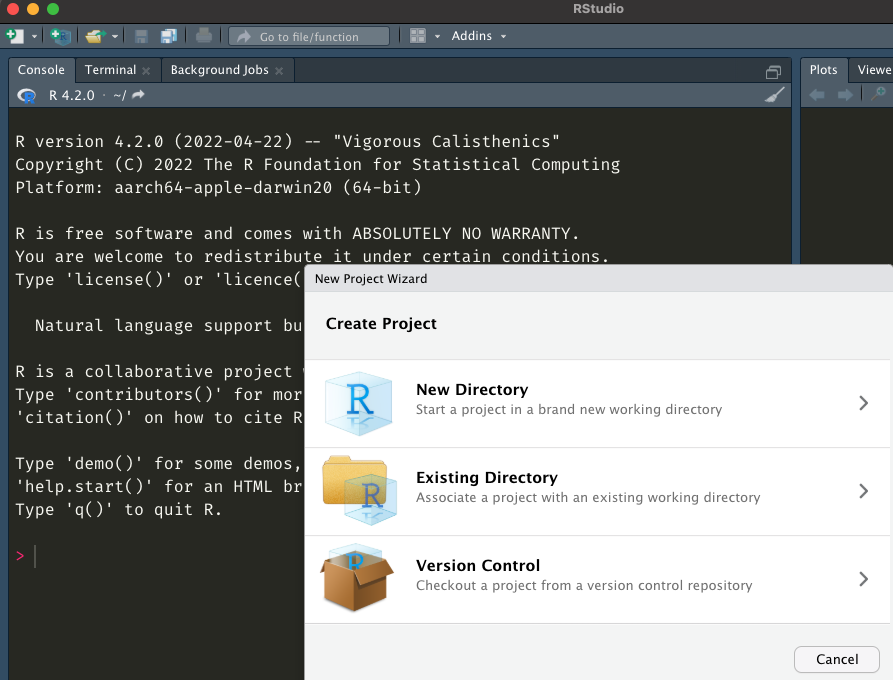
Objects
Everything is an object
Everything has a name
You do stuff with functions
Packages(i.e. libraries) are homes to pre-written functions.
- You can also write your own functions and in some cases should.
Install and loading packages
- Console or Script
install.packages("package-i-need-to-install")- In the case of multiple packages you can do
install.packages(c("Packages", "I", "don't","have"))
- In the case of multiple packages you can do
- RStudio Click the “Packages” tab in the bottom-right window pane. Then click “Install” and search for these two packages.
Install and load(cont.)
Once the packages are installed we need load them into our R session with the library() function
Notice too that you don’t need quotes around the package names any more.
R now recognises these packages as defined objects with given names
Everything in R is an and everything has a name
R Some Basics
Basic Maths
- R is equipped with lots of mathematical operations
Basic Maths
R is also equipped with modulo operations (integer division and remainders), matrix algebra, etc
[1] 1[1] 40Logical Statements & Booleans
| Test | Meaning | Test | Meaning |
|---|---|---|---|
x < y
|
Less than |
x %in% y
|
In set |
x > y
|
Greater than |
is.na(x)
|
Is missing |
==
|
Equal to |
!is.na(x)
|
Is not missing |
x <= y
|
Less than or equal to | ||
x >= y
|
Greater than or equal to | ||
x != y
|
Not equal to | ||
x | y
|
Or | ||
x & y
|
And |
Booleans and Logicals in Action
Logicals, Booleans, and Precedence
Rlike most other programming languages will evaluate our logical operators(==,>, etc) before our booleans(|,&, etc).
What’s happening here is that R is evaluating two separate “logical” statements:
1 > 0.5, which is is obviously TRUE.2, which is TRUE(!) because R is “helpfully” converting it toas.logical(2).It is way safer to make explicit what you are doing.
If your code is doing something weird it might just be because of precedence issues
- See R Cookbook 2.11
Other Useful Tricks
Value matching using %in%
To see whether an object is contained within (i.e. matches one of) a list of items, use %in%.
Cool Now What?
While this is boring it opens up lots
We may need to set up a group of tests to do something to data.
We may need all this math stuff to create new variables
However we need to Assign them to reuse them later in functions.
- Including datasets
Everything is an Object
Assignment
- The most popular assigment operator in R is
<-which is just<followed by-- read aloud as “gets”
- You can also use
->but this is far less common and makes me uncomfortable
Assignment(cont)
- Using
=as an assignment operator also works and is the one I tend to use- Note:
=is also used to evaluate arguments within functions
- Note:
Working with Objects
[1] 6[1] 14.83333[1] 14.83333Global Environment(cont)
Error in mean(y): object 'y' not found- Gives us a hint out about what went wrong
![]()

Fixing Our Issue
- To do this we need to index e to get to y
What are Objects?
- Objects are what we work with in
R
 [1] "is.array"                "is.atomic"
 [3] "is.call"                 "is.character"
 [5] "is.complex"              "is.data.frame"
 [7] "is.double"               "is.element"
 [9] "is.environment"          "is.expression"
[11] "is.factor"               "is.finite"
[13] "is.function"             "is.infinite"
[15] "is.integer"              "is.language"
[17] "is.list"                 "is.loaded"
[19] "is.logical"              "is.matrix"
[21] "is.na"                   "is.na.data.frame"
[23] "is.na.numeric_version"   "is.na.POSIXlt"
[25] "is.na<-"                 "is.na<-.default"
[27] "is.na<-.factor"          "is.na<-.numeric_version"
[29] "is.name"                 "is.nan"
[31] "is.null"                 "is.numeric"
[33] "is.numeric_version"      "is.numeric.Date"
[35] "is.numeric.difftime"     "is.numeric.POSIXt"
[37] "is.object"               "is.ordered"
[39] "is.package_version"      "is.pairlist"
[41] "is.primitive"            "is.qr"
[43] "is.R"                    "is.raw"
[45] "is.recursive"            "is.single"
[47] "is.symbol"               "is.table"
[49] "is.unsorted"             "is.vector"
[51] "isa"                     "isatty"
[53] "isBaseNamespace"         "isdebugged"
[55] "isFALSE"                 "isIncomplete"
[57] "isNamespace"             "isNamespaceLoaded"
[59] "isOpen"                  "isRestart"
[61] "isS4"                    "isSeekable"
[63] "isSymmetric"             "isSymmetric.matrix"
[65] "isTRUE" Vectors
Come in two flavors
Atomic: all the stuff must be the same type
Lists: stuff can be different types
Atomic Vectors
Come in a variety of flavors
Numeric: Can contain whole numbers or decimals
Logicals: Can only take two values TRUE or FALSE
Factors: Can only contain predefined values. Used to store categorical data
- Ordered factors are special kind of factor where the order of the level matters.
Characters: Holds character strings
- Base R will often convert characters to factors. That is bad because it will choose the levels for you
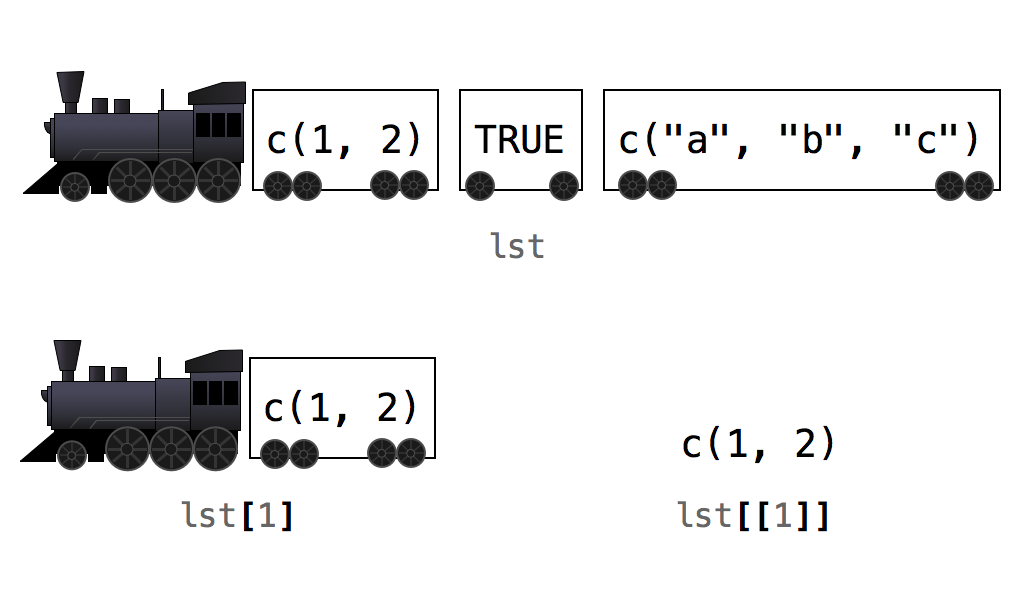
Lists
- Lists are everywhere in R
[1] "list"Error in data.frame(a = 1:3, b = 1:4): arguments imply differing number of rows: 3, 4A Quick Aside on Naming Stuff
Things we can never name stuff
The reason we can’t use any of these are because they are reserved for R
A Quick Aside on Naming Stuff(cont)
Semi-reserved words
For simple things like assigning c = 4 and then doing d = c(1,2,3,4) R will be able to distinguish between assign c the value of 4 and the c that calls concatenate which is way more important in R.
However it is generally a good idea, unless you know what you are doing, to avoid naming things that are functions in R because R will get confused.
How and What to Name Objects
The best practice is to use concise descriptive names
When loading in data typically I do raw_my_dataset_name and after data all of my cleaning I do clean_my_dataset_name
- Objects must start with a letter. But can contain letters, numbers,
_, or.- snake_case_like_this_is_what_I_use
- somePeopleUseCamelCase
- some_People.are_Do_not.like_Convention
Navigating Objects in R
The Data We are Working With

artwork by @allison_horst
Importing Data
You have the option of pointing and clicking via import dataset
I would recommend importing data via code
- You don’t have to remember what you named the object originally
- Saves future you time
This is a common error you will get
Error in file(file, "rt"): cannot open the connectionError in file(file, "rt"): cannot open the connection- This happens most often when
- the file name is spelled wrong
- the file is in a subdirectory or your working directory is not set correctly
Your Turn
Create a vector in R named
my_vecwith “Game of Thrones” in it.Create a vector in R named my_second_vec with
1:100in itRead in the data included to the website using
read.csv- What happens when you do not assign the dataset?
- If you are on a Windows machine right click on the zip file and then click
extract all
Assign the
penguinsdataset to an object named penguinsUse
View,head, andtailto inspect the datasetUsing
install.packages()install ggplot2
04:00
Our Data
| species | island | bill_length_mm | bill_depth_mm | flipper_length_mm | body_mass_g | sex | year |
|---|---|---|---|---|---|---|---|
| Adelie | Torgersen | 39.1 | 18.7 | 181 | 3750 | male | 2007 |
| Adelie | Torgersen | 39.5 | 17.4 | 186 | 3800 | female | 2007 |
| Adelie | Torgersen | 40.3 | 18.0 | 195 | 3250 | female | 2007 |
| Adelie | Torgersen | NA | NA | NA | NA | NA | 2007 |
| Adelie | Torgersen | 36.7 | 19.3 | 193 | 3450 | female | 2007 |
| Adelie | Torgersen | 39.3 | 20.6 | 190 | 3650 | male | 2007 |
Indexing []
We can use column position to index objects.
There are two slots we can use rows and columns in the brackets if we are using a dataframe like this.
object_name[row number, column number]We can also subset our data by column position using
:orc(column 1, column 2)
Negative Indexing
- We can also exclude various elements using
-and/or tests that I showed you earlier
| island | bill_length_mm | bill_depth_mm | flipper_length_mm | body_mass_g | sex | year |
|---|---|---|---|---|---|---|
| Torgersen | 39.1 | 18.7 | 181 | 3750 | male | 2007 |
| Torgersen | 39.5 | 17.4 | 186 | 3800 | female | 2007 |
| Torgersen | 40.3 | 18.0 | 195 | 3250 | female | 2007 |
| Torgersen | NA | NA | NA | NA | NA | 2007 |
| Torgersen | 36.7 | 19.3 | 193 | 3450 | female | 2007 |
| Torgersen | 39.3 | 20.6 | 190 | 3650 | male | 2007 |
Negative Indexing(cont)
- We can use
-or:as well to subset stuff
| flipper_length_mm | body_mass_g | sex | year |
|---|---|---|---|
| 181 | 3750 | male | 2007 |
| 186 | 3800 | female | 2007 |
| 195 | 3250 | female | 2007 |
| NA | NA | NA | 2007 |
| 193 | 3450 | female | 2007 |
| 190 | 3650 | male | 2007 |
Indexing [] (cont)
We can also do the same thing with lists.
We can tell R what element of a list using a combo of
[]and[[]]
[] vs [[]]
Subsetting By Tests
| species | sex |
|---|---|
| Adelie | female |
| Adelie | female |
| NA | NA |
| Adelie | female |
| Adelie | female |
| NA | NA |
| NA | NA |
| NA | NA |
| NA | NA |
| Adelie | female |
$ Indexing
A really useful way of indexing in R is referencing stuff by name rather than position. - The way we do this is throught the $
Indexing(cont)
$ in action
This will just subset things
| species | island | bill_length_mm |
|---|---|---|
| Gentoo | Biscoe | 46.1 |
| Gentoo | Biscoe | 50.0 |
| Gentoo | Biscoe | 48.7 |
| Gentoo | Biscoe | 50.0 |
| Gentoo | Biscoe | 47.6 |
| Gentoo | Biscoe | 46.5 |
| Gentoo | Biscoe | 45.4 |
| Gentoo | Biscoe | 46.7 |
| Gentoo | Biscoe | 43.3 |
| Gentoo | Biscoe | 46.8 |
$ in action(cont)
      species          island    bill_length_mm  bill_depth_mm
 Adelie   :152   Biscoe   :168   Min.   :32.10   Min.   :13.10
 Chinstrap: 68   Dream    :124   1st Qu.:39.23   1st Qu.:15.60
 Gentoo   :124   Torgersen: 52   Median :44.45   Median :17.30
                                 Mean   :43.92   Mean   :17.15
                                 3rd Qu.:48.50   3rd Qu.:18.70
                                 Max.   :59.60   Max.   :21.50
                                 NA's   :2       NA's   :2
 flipper_length_mm  body_mass_g       sex           year
 Min.   :172.0     Min.   :2700   female:165   Min.   :2007
 1st Qu.:190.0     1st Qu.:3550   male  :168   1st Qu.:2007
 Median :197.0     Median :4050   NA's  : 11   Median :2008
 Mean   :200.9     Mean   :4202                Mean   :2008
 3rd Qu.:213.0     3rd Qu.:4750                3rd Qu.:2009
 Max.   :231.0     Max.   :6300                Max.   :2009
NA's :2 NA's :2 uh oh what happened?
Finding Help
- Asking for help in R is easy the most common ways are
help(thingineedhelpwith)and?thingineedhelpwith
?thingineedhelpwithis probably the most common because it requires less typing.
Fixing our issue
Good documentation fluctuates wildly because it is an open source language
If in doubt
:::
Your Turn
Find the minimum value of
bill_length_mmFind the maximum value of
body_mass_gSubset the penguins data any way you want using column position or
$Assign each of them to an object
Create a vector from 1:10 index that vector using
[]to return 2 and 4
05:00
Some additional useful stuff
Sometimes we want summary statistics per group
- What kind of penguins live where
- Are their any interesting patterns by group etc
Fortunately
Rcomes with some handy functions to usetablecounts each factor leveltapplywill let you group stuff by a factor and get some useful balance statistics
Table
tapply and calculating descriptive statistics by groups
$female

   Adelie Chinstrap    Gentoo
       73        34        58

$male

   Adelie Chinstrap    Gentoo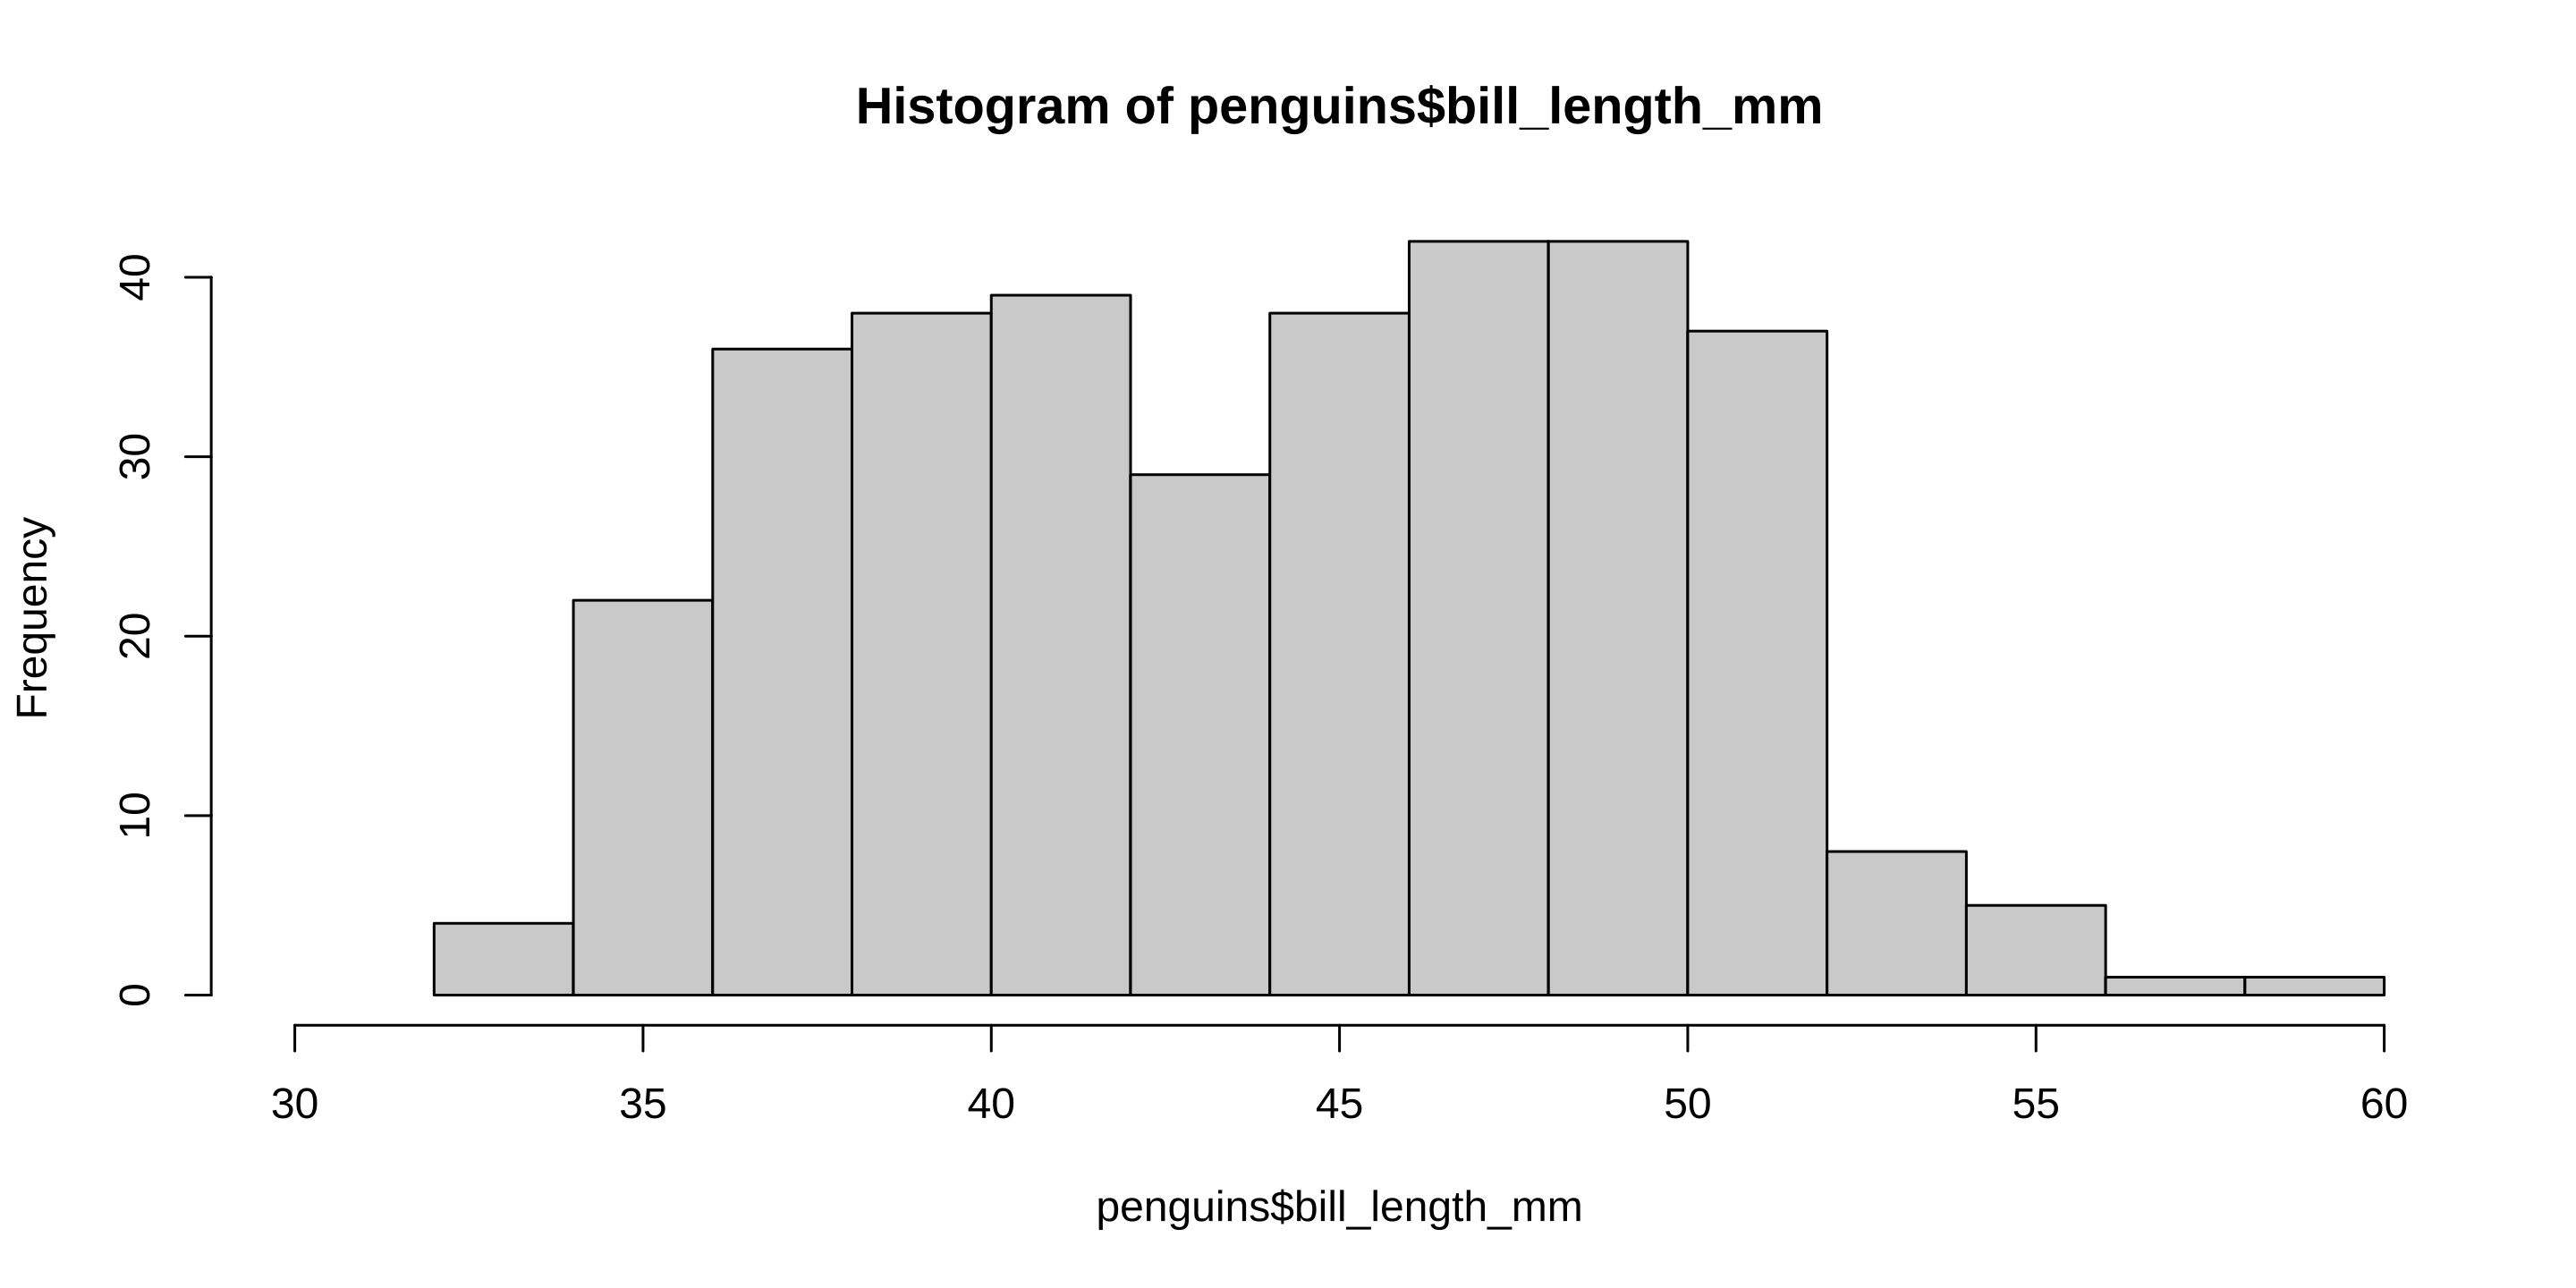
73 34 61 Plotting
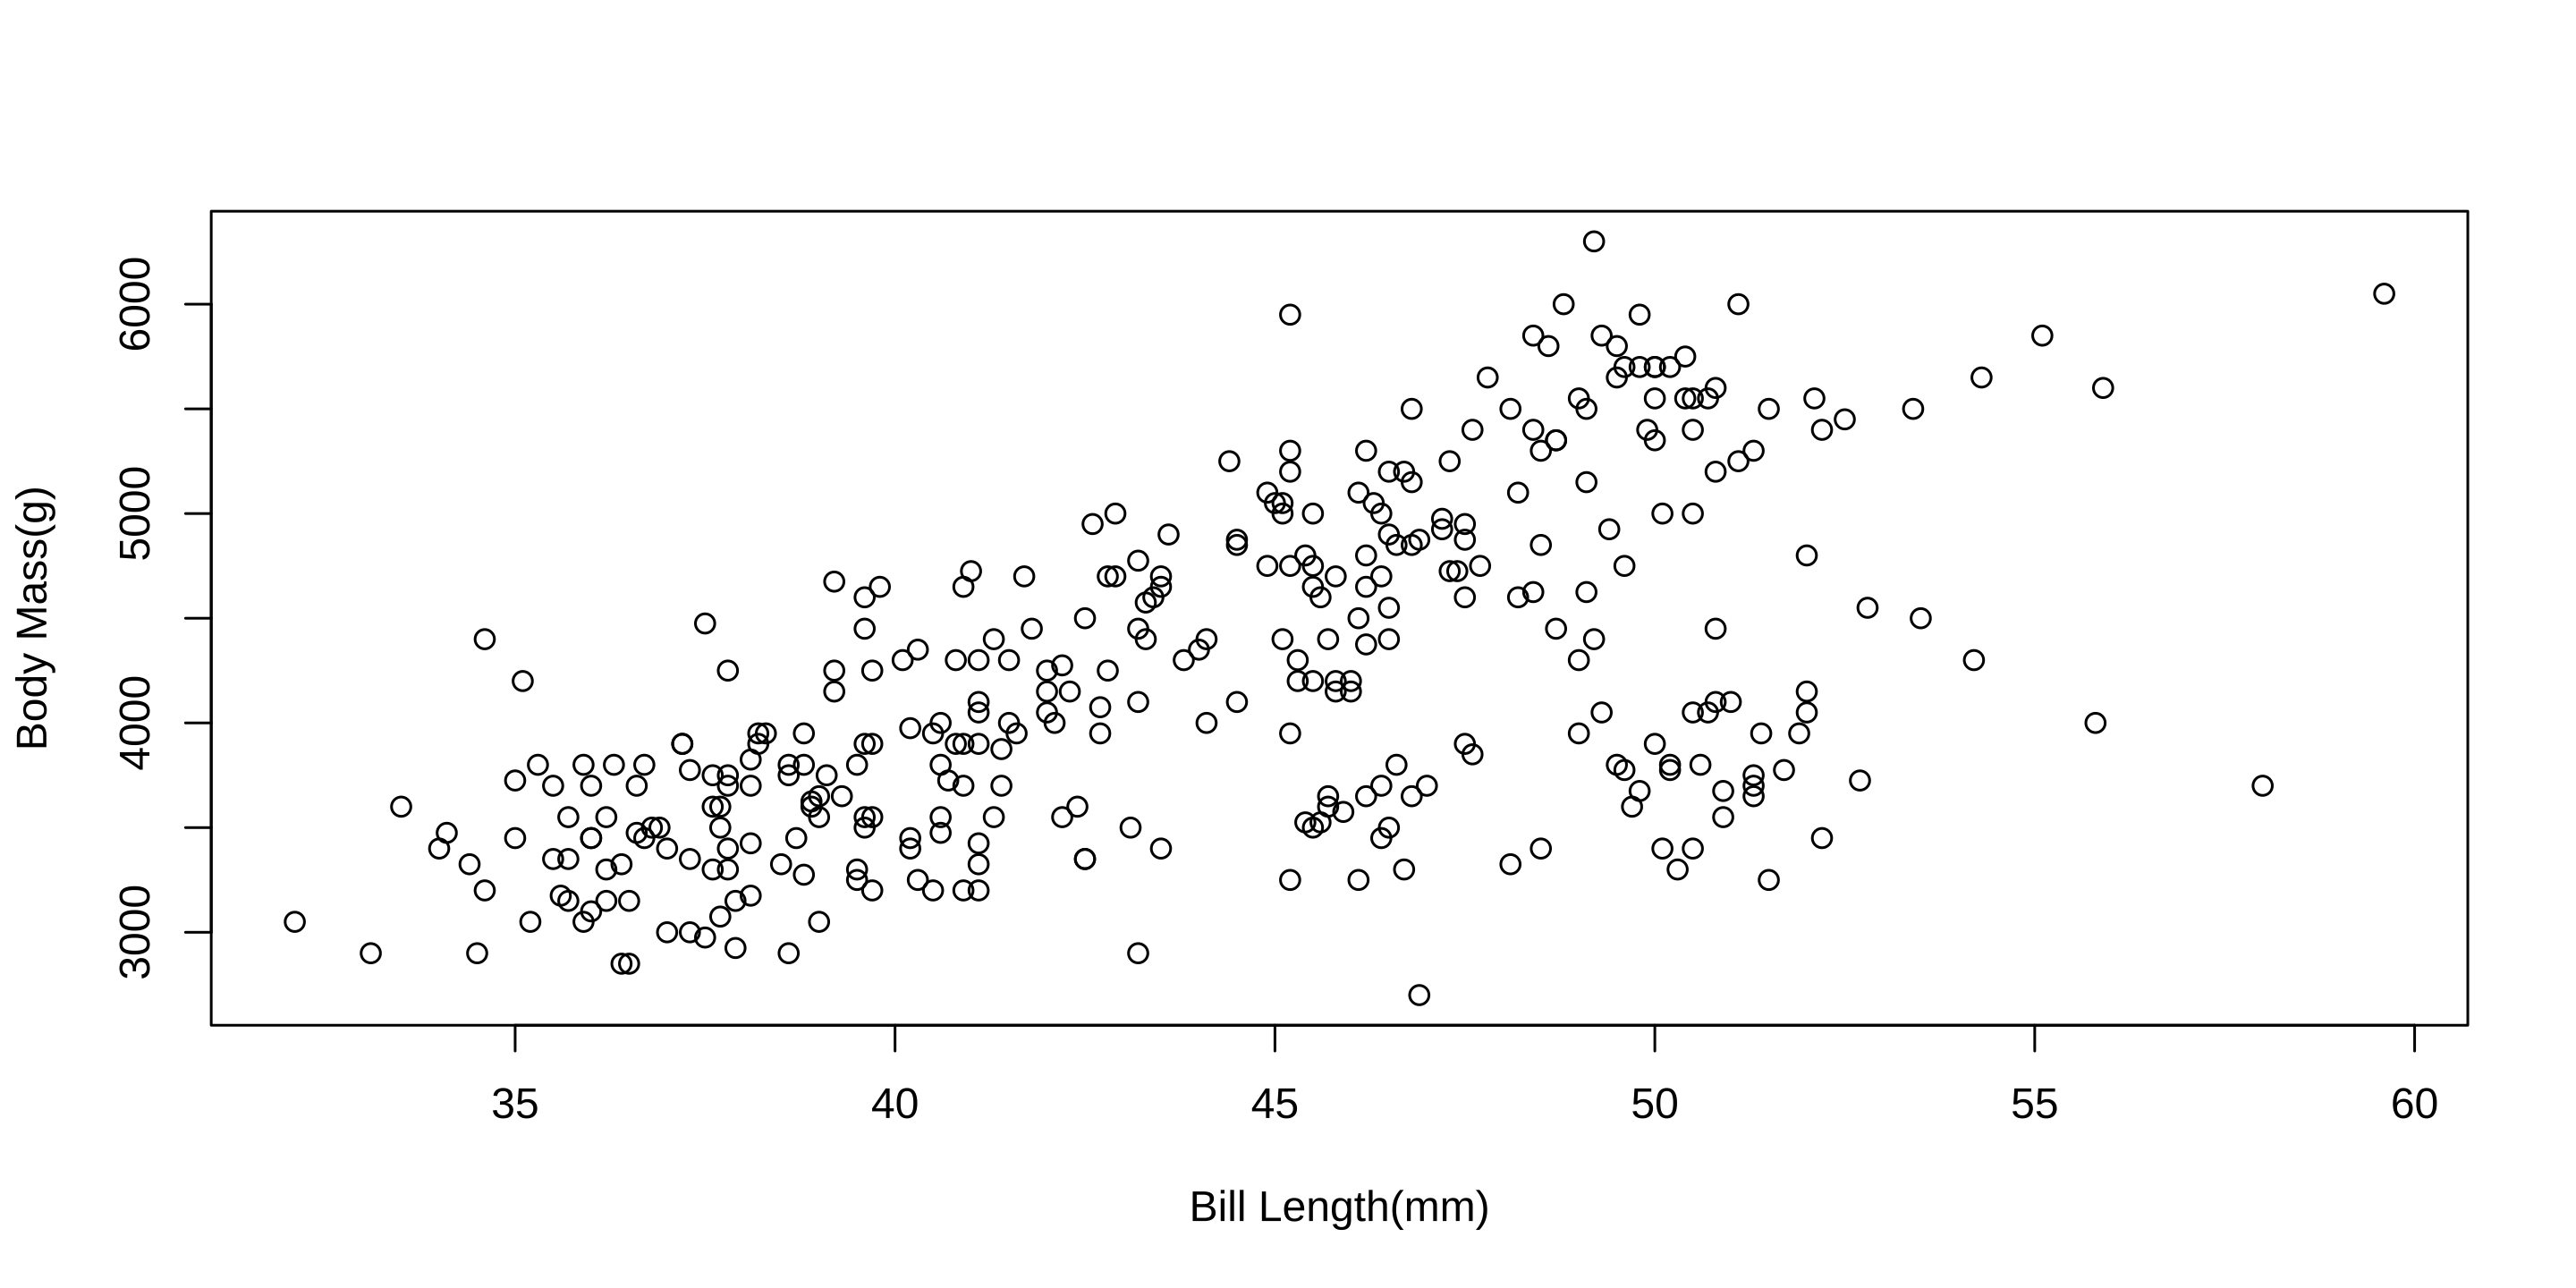
Plotting(cont)
Making New Things
- To foreshadow our next workshop often we need to do things with our data
- Like deal with all those pesky missing values
- Create new variables
- subset our data(kind of like we have been doing)
- recode our variables
- To add new variables we can use what we know
penguins$range_body_mass = max(penguins$body_mass_g, na.rm = TRUE) - min(penguins$body_mass_g, na.rm = TRUE)

penguins$chinstrap[penguins$species == "Adelie" | penguins$species == "Gentoo"] <- "Not Chinstrap"

penguins$chinstrap[penguins$species == "Chinstrap"] <- "Chinstrap"

penguins[,c("species", "range_body_mass", "chinstrap")]
# A tibble: 344 × 3
species range_body_mass chinstrap
<fct> <int> <chr>
1 Adelie 3600 Not Chinstrap
2 Adelie 3600 Not Chinstrap
3 Adelie 3600 Not Chinstrap
4 Adelie 3600 Not Chinstrap
5 Adelie 3600 Not Chinstrap
6 Adelie 3600 Not Chinstrap
7 Adelie 3600 Not Chinstrap
8 Adelie 3600 Not Chinstrap
9 Adelie 3600 Not Chinstrap
10 Adelie 3600 Not Chinstrap
# … with 334 more rowsCleaning up after yourself
rm(objectname)will remove the objects you createdrm(list=ls())will remove all the objects your createdYou can remove packages, sometimes, with
detach(package:packageyouwanttoremove)- This can be iffy for a variety of reasons
- Some packages automatically load another package or depend on another.
However, restarting your
Rsession is generally best practice because it will do both
Getting Good at R
The only way to write good code is to write tons of shitty code first. Feeling shame about bad code stops you from getting to good code
— Hadley Wickham (@hadleywickham) April 17, 2015